Last post, we show how to pull the latest options chain data from Yahoo Finance in Python using yfinance. Now we’re going to turn that raw data into powerful options indicators—think Put/Call Open‑Interest ratios, Volume / Open‑Interest spikes, and more—that can fuel real‑time alerts and reveal large‑trader positioning and whale activity.
Need custom metrics integrated into your options strategy? From the classic Put / Call ratio to bespoke indicators you define yourself, we’ll walk through all the Python code you need to get started with integrating custom indicators to get an edge in options trading.
For those that are totally new to Python you can follow step-by-step guide to getting setup here. Also for those that are interested in checking out making your own Discord server for options signal, this post may be of interest.
📋 Contents
Getting Options Data to Calculate Unusual Activity Metrics
In the last post we used Tesla to get options data, this time we will change it up a bit and get Apple options data and calculate some indicators. Note here we add two derived columns one for the put/call and the other for the expiry, this will be useful for using pandas groupby to calculate our indicators.
import pandas as pd
import yfinance as yf

# Initialize ticker
ticker = yf.Ticker("AAPL")

# Collect all chains
all_chains = []
for expiry in ticker.options:
    chain = ticker.option_chain(expiry)
    # tag each row with its expiry date
    calls = chain.calls.copy().assign(expiry=expiry, side="call")
    puts  = chain.puts.copy().assign(expiry=expiry, side="put")
    all_chains.extend([calls, puts])

# concatenate into one DataFrame
options_df = pd.concat(all_chains, ignore_index=True)

# optional: reorder columns so expiry/side come first
cols = ["expiry", "side"] + [c for c in options_df.columns if c not in ("expiry", "side")]
options_df = options_df[cols]

print(options_df.head())


'''
       expiry  side       contractSymbol             lastTradeDate  strike  \
0  2025-04-25  call  AAPL250425C00100000 2025-04-16 16:50:54+00:00   100.0
1  2025-04-25  call  AAPL250425C00110000 2025-04-21 16:31:25+00:00   110.0
2  2025-04-25  call  AAPL250425C00120000 2025-04-21 16:31:25+00:00   120.0
3  2025-04-25  call  AAPL250425C00125000 2025-04-17 18:38:53+00:00   125.0
4  2025-04-25  call  AAPL250425C00126000 2025-04-17 14:56:35+00:00   126.0

   lastPrice    bid    ask     change  percentChange  volume  openInterest  \
0      97.30  92.10  93.55   0.000000       0.000000    10.0            18
1      81.42  82.15  83.55  -2.240006      -2.677511     2.0            19
2      71.45  72.15  73.60 -10.750000     -13.077859     2.0            65
3      73.45  67.15  68.65   0.000000       0.000000     2.0            32
4      70.13  66.15  67.70   0.000000       0.000000     4.0             7

'''
Put / Call Ratio
What is the Put Call Ratio?
The Put / Call Open‑Interest Ratio is shown by the formula below. It is calculated by taking the sum of put option open interest and dividing by sum of call open interest.
\([ \mathrm{PCR}_{\mathrm{OI}} \;=\; \frac{\displaystyle\sum \mathrm{OI}_{\text{puts}}} {\displaystyle\sum \mathrm{OI}_{\text{calls}}} ]\)
The Put/Call ratio is widely used to gauge trader sentiment, higher values indicating increased levels of fear in the market
PCR > 1 suggests bearish sentiment (more puts outstanding than calls)
PCR < 1 suggests bullish sentiment (more calls outstanding than puts)
Python Code to Calculate Put Call Ratio ⬇️
# groupby expiry
oi_by_side = (
    options_df
      .groupby(['expiry', 'side'])['openInterest']
      .sum()
      .unstack('side')
)

# calculate the Put/Call Ratio
oi_by_side['PCR_OI'] = oi_by_side['put'] / oi_by_side['call']

oi_by_side.index = pd.to_datetime(oi_by_side.index)
oi_by_side = oi_by_side.sort_index()

print(oi_by_side[['call', 'put', 'PCR_OI']])

'''
ide          call     put    PCR_OI
expiry
2025-04-25  262740  151940  0.578290
2025-05-02   88577   63672  0.718832
2025-05-09   34851   22894  0.656911
2025-05-16  266811  197127  0.738826
2025-05-23   15218    9173  0.602773
2025-05-30    6269    8436  1.345669

'''
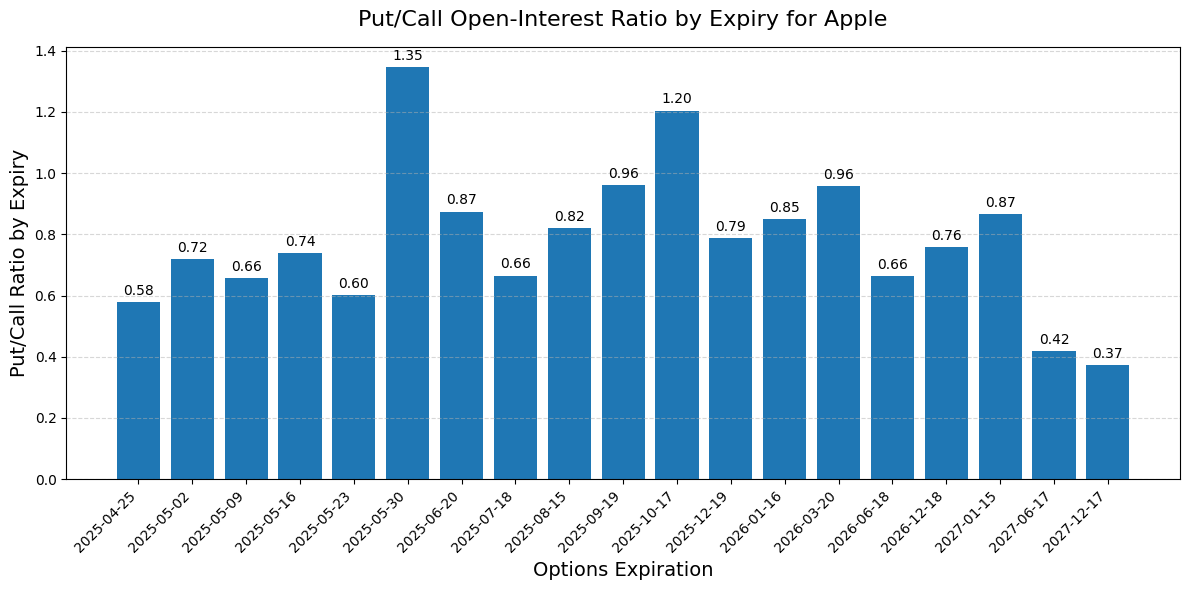
Plot Put call Ratio
labels = oi_by_side.index.strftime('%Y-%m-%d')


fig, ax = plt.subplots(figsize=(12, 6))

bars = ax.bar(labels, oi_by_side['PCR_OI'])


ax.set_title('Put/Call Open‑Interest Ratio by Expiry for Apple', fontsize=16, pad=15)
ax.set_xlabel('Options Expiration', fontsize=14)
ax.set_ylabel('Put/Call Ratio by Expiry', fontsize=14)


ax.grid(axis='y', linestyle='--', alpha=0.5)
plt.xticks(rotation=45, ha='right')

for bar in bars:
    height = bar.get_height()
    ax.annotate(f'{height:.2f}',
                xy=(bar.get_x() + bar.get_width() / 2, height),
                xytext=(0, 3),              # 3 points vertical offset
                textcoords='offset points',
                ha='center', va='bottom',
                fontsize=10)

plt.tight_layout()
plt.show()
Unusual Activity: Volume Spike vs. Open Interest
What is Unusual Activity and Vol / OI Ratio
“Unusual options activity” refers to trading patterns that stand out from the norm—typically characterized by spikes in volume, sudden changes in implied volatility, or large block trades. Among these signals, the volume‑to‑open interest (Volume/OI) ratio is one of the simplest and most powerful metrics for spotting fresh positioning in the market.
A high Volume/OI ratio tells you that today’s trading activity is large relative to the number of contracts already outstanding, often flagging large directional bets or hedges before major events.
\([ \mathrm{vol\_to\_oi}_i \;=\; \frac{\mathrm{volume}_i}{\mathrm{openInterest}_i} \quad(\text{where }\mathrm{openInterest}_i>0) ]\)
Python code to Calculate Volume / OI Indicator
import pandas as pd
import numpy as np

# calculate the volume / OI ratio per contract
options_df['vol_to_oi'] = np.where(
    options_df['openInterest'] > 0,
    options_df['volume'] / options_df['openInterest'],
    np.nan
)

#group by expiry & side
ratio_by_side = (
    options_df
      .groupby(['expiry', 'side'])['vol_to_oi']
      .mean()
      .unstack(level='side')
)

#  calc the total (across both calls and puts) per expiry
total_ratio = (
    options_df
      .groupby('expiry')['vol_to_oi']
      .mean()
      .rename("total")
)

# combine
ratio_summary = pd.concat([ratio_by_side, total_ratio], axis=1).sort_index()

print(ratio_summary)


'''
             call       put     total
expiry
2025-04-25  0.907152  1.161929  1.027628
2025-05-02  0.792265  0.456009  0.649260
2025-05-09  0.591911  0.344745  0.495996
2025-05-16  0.139945  0.320714  0.219031
2025-05-23  0.380570  0.229420  0.317591
'''
Plot Results to Identity Unusual Activity
import numpy as np
import pandas as pd
import matplotlib.pyplot as plt


ratio_summary.index = pd.to_datetime(ratio_summary.index)


x = np.arange(len(ratio_summary.index))
width = 0.25
# plot unsual options activity
fig, ax = plt.subplots(figsize=(10, 6))

ax.bar(x - width, ratio_summary['call'], width, label='Call', color='green')
ax.bar(x,       ratio_summary['put'],  width, label='Put',  color='red')
ax.bar(x + width, ratio_summary['total'], width, label='Total',color='blue')


ax.set_title('Mean Volume/Open Interest Ratio by Expiry and Side', fontsize=16)
ax.set_xlabel('Expiry Date', fontsize=14)
ax.set_ylabel('Mean Volume/OI Ratio', fontsize=14)
ax.set_xticks(x)
ax.set_xticklabels(
    ratio_summary.index.strftime('%Y-%m-%d'),
    rotation=45, ha='right'
)
ax.legend(title='Option Side')
ax.grid(axis='y', linestyle='--', alpha=0.7)
plt.tight_layout()

plt.show()
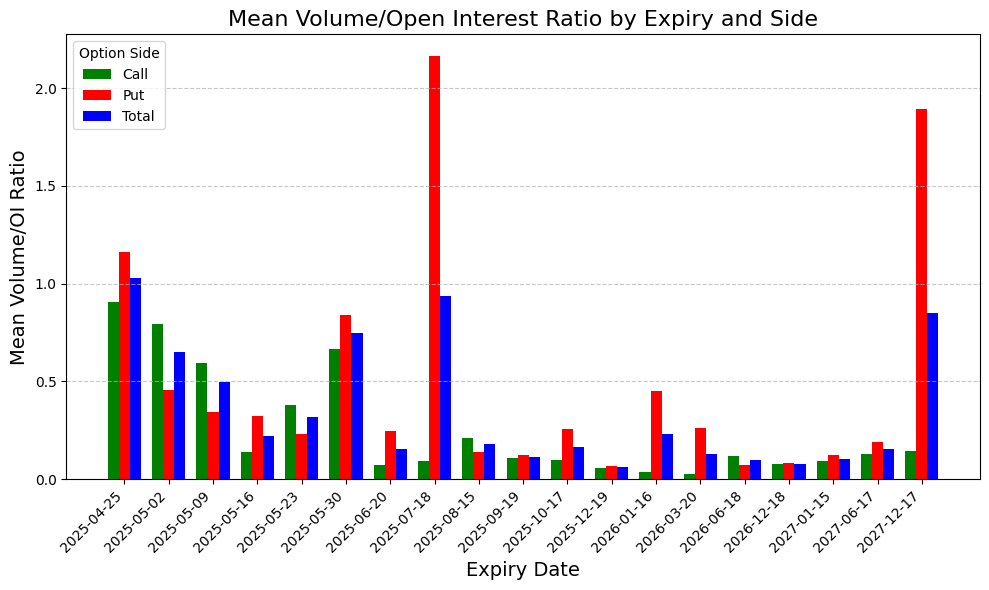
From the plot above we can see that there is some unusual put activity for both the July 2025 & Dec 2027 Contracts, possibly signaling worries about downside volatility in the stock.
📚 Further Reading
- 🔗 Learn to Make Python Dashboards to Integrate This code
- 🔗 Get started with Python FastAPI
- 🔗 Completely New To Python Beginner Setup