What is Pandas and why use It?
Pandas is an incredibly useful tool for data analysis created by American software developer Wes McKinney as a tool to perform quantitative analysis on financial data. It is most easily described as being a more flexible version of Microsoft Excel. Where Excel uses a spreadsheet, Pandas uses a dataframe.
Pandas is widely used in a range of industries including finance, marketing, tech among others. It is particularly useful in the emerging field of machine learning due to its compatibility with high-level machine learning libraries.
Pandas is able to interact with Excel, csv, sql files along with many others, which makes transitioning from Excel very smooth. Although it may seem time consuming at first, uses Pandas has the potential to dramatically speed up your workflow due to the reusability of the code which allows automating repetitive tasks.
Choosing an Editor
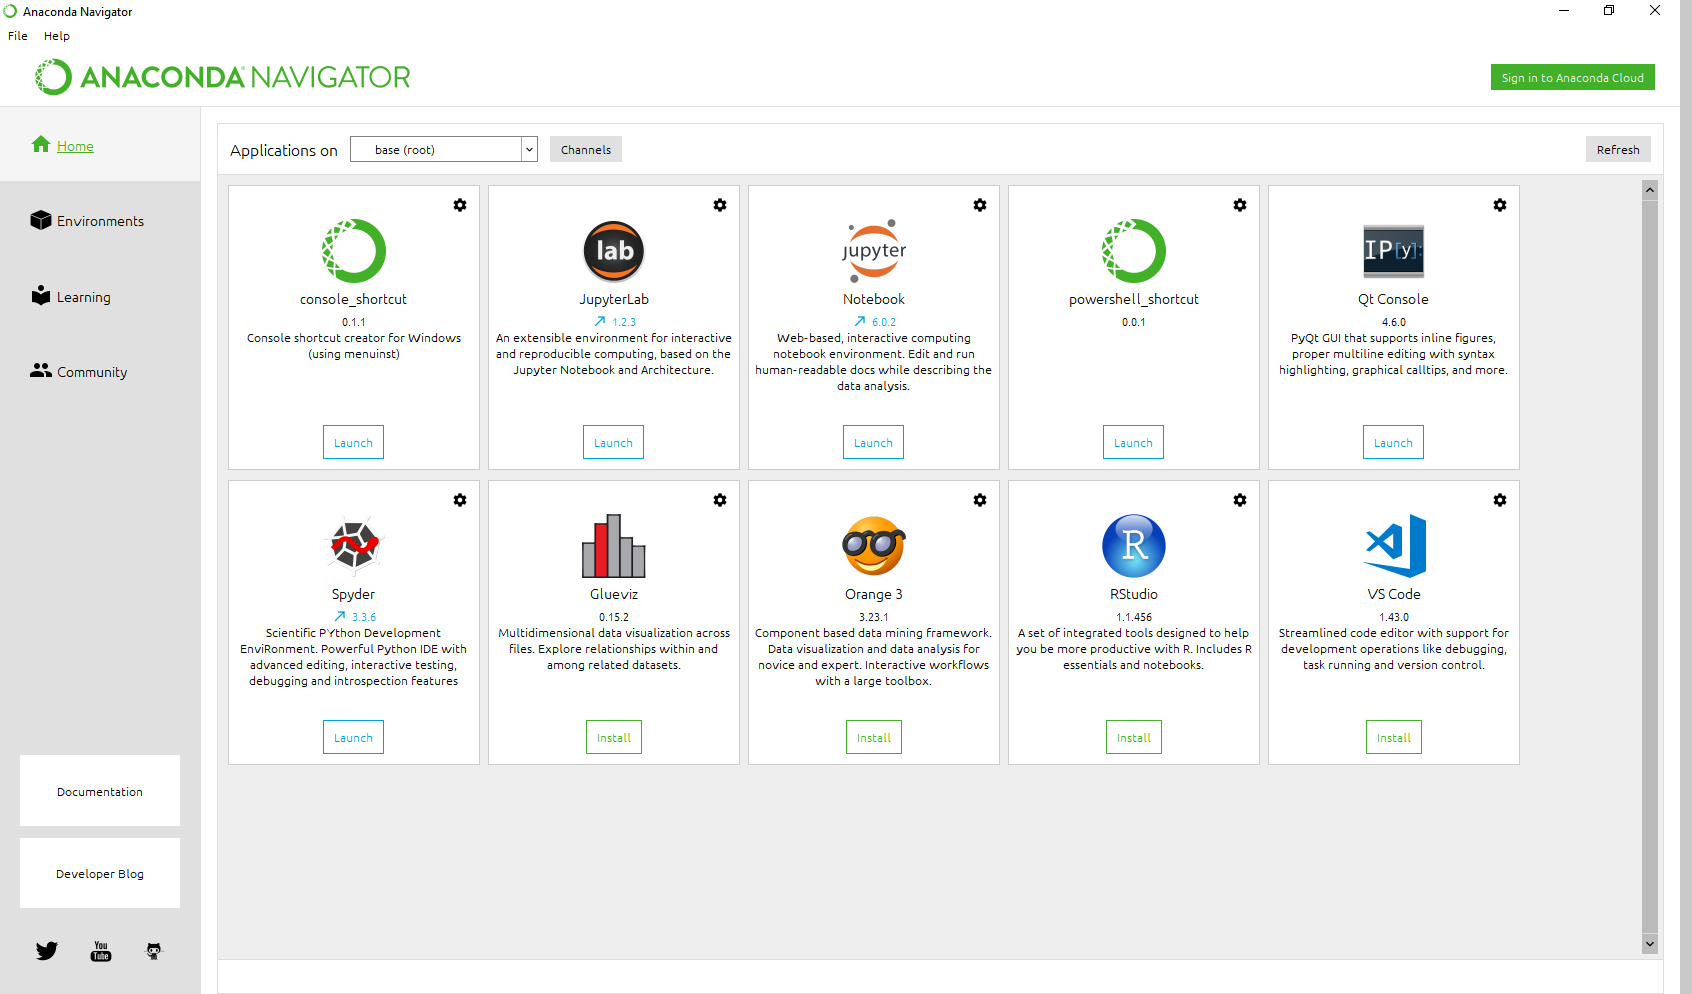
The first step in getting started with Pandas is to choose an Editor. There are too many editors to list, each of which have their pros and cons. Beginners often find it complicated to get up and running due to installation issues and unfamiliarity working with the command line. If you feel this applies to you then Anaconda is an excellent choice to avoid complicated installation procedures. It is also 100% free to use! Once Anaconda has been downloaded you can simply go to Programs> Anaconda > Anaconda Navigator and you will see the following screen.
It is recommended to create a virtual environment by clicking Environments > Create , Then give the environment a name for example ‘Pandas_env’ after which select the latest version of Python (3.7 at the time of writing). Once back at the Anaconda Navigator home screen click Applications on and select the environment you just created.
You can now install editors! Either Sypder or Jupyter Notebook are good choices for using Pandas as they allow line-by-line code execution and easily visualization of data. In fact, since it is so easy, you can’t go wrong installing both and seeing which one you prefer!
Installing Pandas
For Spyder type the following command into the IPython Console
In [2]: pip install pandas
For Jupyter simply type:
pip install pandas into the first cell and press Ctrl+Enter.
You now have the latest version of Pandas installed! Congrats!
It may also be useful to install the following packages:
pip install matplotlib

pip install pandas_datareader
Matplotlib is a useful plotting library that works well with Pandas and pandas_datareader is a package that allows downloading data directly from the web. Both of which are very useful for getting started with Pandas.
Importing Pandas
To use Pandas you will need to import it using the following command:
import pandas as pd
Why do you need to import as pd? Well you don’t, you could import it as anything you like really, for example: import pandas as p , import pandas as gorillas etc. However, it is highly recommended to import as pd as nearly all the books / online resources available using the pd naming convention and sticking to this will make learning pandas much easier.
First Pandas Dataframe
Notice that df stands for dataframe, again this is just a naming convention that is widely used in learning resources. However, this naming convention isn't as widespread as the 'pd' due to the fact that you will often have multiple dataframes to work with and naming them all 'df' will very likely lead to serious problems!
To create your first dataframe your script should look something like this:
import pandas as pd


df = pd.DataFrame({'A': [1,3,5,0,5,1],
                    'B': [1,3,5,0,5,1],
                    'C':[1,2,3,4,6,8]})

print(df)
After executing the script above you should see:
   A  B  C
0  1  1  1
1  3  3  2
2  5  5  3
3  0  0  4
4  5  5  6
5  1  1  8
Three Buidling Blocks of Pandas Dataframes
Pandas Index
Notice above that Pandas has added extra numbers 0,1,2,3,4,5 on the left of the dataframe created above. This is known as the index. You can check the index of a dataframe by typing:
print(df.index)
And you should see the following output:
RangeIndex(start=0, stop=6, step=1)
This is automatically created by Pandas if not specified otherwise. The index in Pandas is especially useful for manipulating timeseries data.
Rows
Continuing with the example shown above, the rows in our example data are labelled below. It is important to note that Python begins indexing at 0! This may be confusing for users coming from R or Matlab where the index starts at 1.
   A  B  C
0  1  1  1 #row 0
1  3  3  2 #row 1
2  5  5  3 #row 2
3  0  0  4 #row 3
4  5  5  6 #row 4
5  1  1  8 #row 5
To gain familiarity with the way Pandas / Python reference rows it may be useful to play around with the following command which uses the index as discussed above:
df[df.index==0]

##shows
   A  B  C
0  1  1  1


df[df.index==1]

##shows
   A  B  C
1  3  3  2

df[df.index==5]

##shows
   A  B  C
5  1  1  8
There are a multitude of other, more flexible ways to reference rows, which you can check out later in this Pandas series.
Columns
Columns in the example above refer to A, B & C. To reference a column simply type:
df.A

##shows

0    1
1    3
2    5
3    0
4    5
5    1
Alternatively you can use:
df['A']
Which gives the same output as above.