The majority of data-sets in real life are likely to be messy and require data cleaning before any analysis can be done. This often takes the form of missing values. The handling of of missing values is often highly domain specific. For example, in a survey the omission of of a data-point (a question) can often convery information. This is also a feature of credit application / default data-sets. Pandas has a number of useful built-in methods for dealing with missing data effectively.
Types of Missing Data
- NaN values: This stands for 'Not a Number' which naturally relates to numeric series in which data is missing.
- NaT values: This relates to missing values in a datetime object: 'Not a Date'
- None: None values for regular Python can also show up in Pandas objects.
- '?' : This is an example of a symbol that can be found in place of missing values, generally for categorical data. Any symbol could be used in place of '?' however, a number of data-sets on the popular UCI Machine Learning Repository use the '?' symbol which is why I use it as an example here.
- -99999: Sometimes you will find a large negative integer in place of missing values, this is similar to the '?' above except it is used for numeric series.
This article will focus on NaN values:
Import necessary modules and take the series 'S' as an example:
import pandas as pd
import matplotlib.pyplot as plt
import numpy as np
plt.style.use('seaborn')


S = pd.Series([1, 2, 3, np.nan, 5, 6])

print(S)
Which returns:
0    1.0
1    2.0
2    3.0
3    NaN
4    5.0
5    6.0
dtype: float64
Which methods can we use to handle this?
(if you want the new data to replace the old in memory, you can add inplace=True in the methods listed below)
1) Drop missing values
This is perhaps the most simple method of handling missing data. However, when working with dataframes this can cause the loss of valuable data.
# S.dropna(inplace=True) to replace old series

S.dropna()
Out[143]:
0    1.0
1    2.0
2    3.0
4    5.0
5    6.0
dtype: float64
2) Fill missing values with a custom value
Say for instance, you want to replace all NaN values with zeros
S.fillna(0)
Out[144]:
0    1.0
1    2.0
2    3.0
3    0.0
4    5.0
5    6.0
dtype: float64
3) Fill NaN values with the mean of the series
S.fillna(S.mean())
\(3.4 = \frac{1+2+3+ 5 +6}{5}\)
Out[145]:
0    1.0
1    2.0
2    3.0
3    3.4 #mean
4    5.0
5    6.0
dtype: float64
4) Back-fill and Forward-fill methods (bfill & ffill)
It can take a while to get used to which is which when using these methods! See the image below for a visual understanding of what each of this methods do:
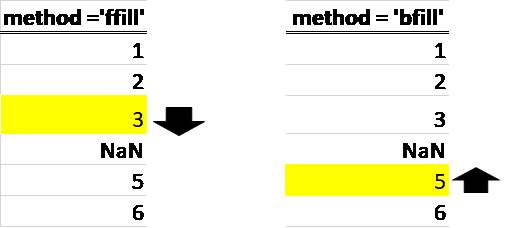
S.fillna(method='ffill')
0    1.0
1    2.0
2    3.0
3    3.0
4    5.0
5    6.0
dtype: float64
S.fillna(method='bfill')
Out[150]:
0    1.0
1    2.0
2    3.0
3    5.0
4    5.0
5    6.0
dtype: float64
5) Interpolation
Interpolation is essentially; estimating a data-point based on a known range. This method is particularly useful when working with time series data.
S.interpolate()
\(\frac{t_{i-1}\ +\ t_{i+1}}{2}\ \ =\ \frac{3\ +5}{2}=4 \)
Out[151]:
0    1.0
1    2.0
2    3.0
3    4.0 #interpolated value
4    5.0
5    6.0
dtype: float64
Example with a DataFrame
Take the dataframe below as an example:
# use this to get the same random numbers as used in this example
np.random.seed(100)

# generate an array of random integers 100 rows 5 columns
rand = np.random.randint(0, 100, size=(100,5))

# adding some NaN values for illustrative purposes
rand = np.where(rand > 90, np.nan, rand)

# create the data frame
columns = ['col1','col2','col3','col4','col5']

df = pd.DataFrame(rand, columns = columns)

df.head(10)
Out[154]:
   col1  col2  col3  col4  col5
0   8.0  24.0  67.0  87.0  79.0
1  48.0  10.0   NaN  52.0   NaN
2  53.0  66.0   NaN  14.0  34.0
3  24.0  15.0  60.0  58.0  16.0
4   9.0   NaN  86.0   2.0  27.0
5   4.0  31.0   1.0  13.0  83.0
6   4.0   NaN  59.0  67.0   7.0
7  49.0  47.0  65.0  61.0  14.0
8  55.0  71.0  80.0   2.0   NaN
9  19.0   NaN  63.0  53.0  27.0
df.isna().sum() is a useful command to count the number of NaN values column-wise:
df.isna().sum()
Out[155]:
col1     8
col2     9
col3    10
col4    10
col5    13
dtype: int64
This is relatively easy to interpret since there's only one hundred rows in the dataframe. How could we make this easier to interpret for larger data-sets? Well we could calculate the number of NaN values as a percentage of the total number of rows in the dataframe. Let's say we are going to drop any columns with more than 10% NaN values. The code snippet below calculates the percentage of NaN values per column and plots them in a bar chart:
#calculate pecentage missing values
(df.isna().sum() /len(df)).plot.bar()

#set threshold
Threshold = 0.10

#plot horizontal line with threshold value
plt.axhline(Threshold,color='red')
Which returns the following plot
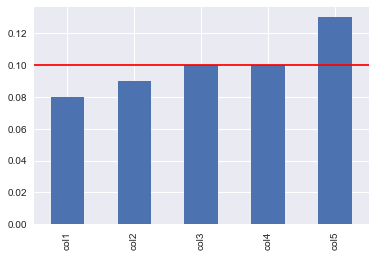
Ok, so let's drop column 5 and use a different method to fill in the NaN values for each of the remaining columns.
# delete columns with more than 10% missing
del df['col5']

### fill with mean for column 1
df.col1.fillna(df.col1.mean(), inplace=True)

# fill with median for column 2
df.col2.fillna(df.col2.median(), inplace=True)

# forward fill values for column 3
df.col3.fillna(method='ffill',inplace=True)

# interpolate for column 4
df.col4.interpolate(method='linear', inplace=True)

df.head(10)
Out[159]:
   col1  col2  col3  col4
0   8.0  24.0  67.0  87.0
1  48.0  10.0  67.0  52.0
2  53.0  66.0  67.0  14.0
3  24.0  15.0  60.0  58.0
4   9.0  44.0  86.0   2.0
5   4.0  31.0   1.0  13.0
6   4.0  44.0  59.0  67.0
7  49.0  47.0  65.0  61.0
8  55.0  71.0  80.0   2.0
9  19.0  44.0  63.0  53.0
Let's double check for missing values:
df.isna().sum()
Out[160]:
col1    0
col2    0
col3    0
col4    0
dtype: int64
Cool, now we have a clean data-set. If you want to try the methods above on a real data-set, you can use the following code snippet to download the Titanic data from Vanderbilt University. Good luck!
##titanic dataset url from vanderbilt
url = 'http://biostat.mc.vanderbilt.edu/wiki/pub/Main/DataSets/titanic3.csv'

df= pd.read_csv(url)

df.head()
Out[162]:
   pclass  survived  ...   body                        home.dest
0       1         1  ...    NaN                     St Louis, MO
1       1         1  ...    NaN  Montreal, PQ / Chesterville, ON
2       1         0  ...    NaN  Montreal, PQ / Chesterville, ON
3       1         0  ...  135.0  Montreal, PQ / Chesterville, ON
4       1         0  ...    NaN  Montreal, PQ / Chesterville, ON

[5 rows x 14 columns]