Yahoo Finance
Getting stock prices with Pandas is very easy. Ensure you have pandas_datareader, which can be installed with pip install pandas_datareader, then make your imports if you wish to follow along with this article.
import pandas_datareader.data as web
import pandas as pd
import datetime as dt
import matplotlib.pyplot as plt
plt.style.use('ggplot')
The first source we will use for this article is Yahoo Finance, generally the data from Yahoo is of good quality, with an added bonus of being 100% free and no sign up required! There are a minimum of four options we must specify in order to download the data.
#start of the data
start = dt.datetime(2010,1,1)

#last data point to download
end =dt.datetime(2020,1,1)

# name of the stock symbol
symbol = 'AAPL' ###using Apple as an example

##source of the data
source = 'yahoo'

# pass in the arguments above to pandas datareader
data = web.DataReader(symbol, source, start, end)

##view first 5 rows of the data
data.head()
Running the script above should return the following in your console:
                 High        Low       Open      Close       Volume  Adj Close
Date
2010-01-04  30.642857  30.340000  30.490000  30.572857  123432400.0  26.538483
2010-01-05  30.798571  30.464285  30.657143  30.625713  150476200.0  26.584366
2010-01-06  30.747143  30.107143  30.625713  30.138571  138040000.0  26.161509
2010-01-07  30.285715  29.864286  30.250000  30.082857  119282800.0  26.113146
2010-01-08  30.285715  29.865715  30.042856  30.282858  111902700.0  26.286753
If you get an error similar to the following:
RemoteDataError: No data fetched for symbol AAPffL using YahooDailyReader
This likely means you have typed in the stock symbol incorrectly. If the stock symbol is in fact correct it is also possible you have incorrectly specified the country suffix, for instance let's take a look at BMW which is a German company. Check out the Yahoo Finance page here, notice that the stock the information is structured as follows:
Bayerische Motoren Werke Aktiengesellschaft (BMW.DE)
So for German based companies we must append .DE to the symbol.The same is true for British based companies in that a .L must be appended to the symbol in order to download it correctly.
The error below relates to an incorrect specification of the data source.
NotImplementedError: data_source='yahgoo' is not implemented
Going back to the example of Apple's stock data, say for instance you only wanted to download the adjusted close as opposed to the high, low, volume etc, you can specify this as follows:
data = web.DataReader(symbol, source, start, end)['Adj Close']
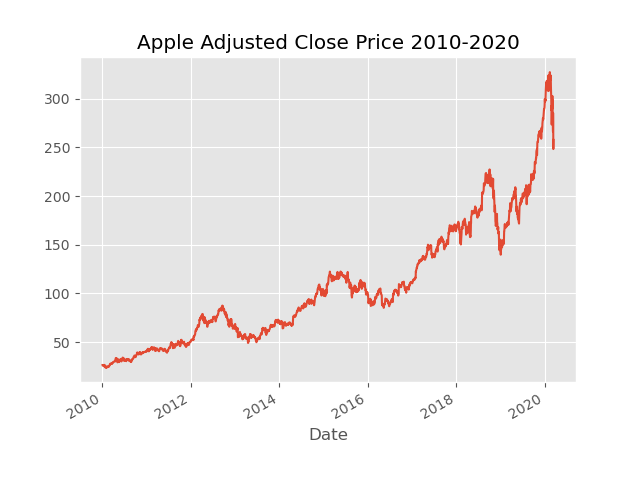
It is usually a good idea to plot the data to investigate any obvious errors or suspiciously large moves in the price.
data = web.DataReader(symbol, source, start, end)['Adj Close']

data.plot()
plt.title('Apple Adjusted Close Price 2010-2020')
Quandl
Quandl is another great choice for getting high quality data. You will need to install their Python package with pip install quandl in your terminal / console. You don't need an account to get up to 50 API calls / day from Quandl. However, I do recommend getting a free account as they have lots of interesting free data sets, and they don't email spam!
Make the following imports:
import quandl
import pandas as pd
import datetime as dt
import matplotlib.pyplot as plt
plt.style.use('ggplot')
The syntax for downloading data from Quandl is similar to Yahoo Finance, however specifying a start date isn't required, if you don't specify a start date Quandl will simply return all available data when you reference a security. Let's try with Apple:
data = quandl.get('WIKI/AAPL')

data.head()
The "WIKI" here refers to the database on Quandl followed by the security name, I encourage you to check out their website for a full list of datasets available. Quandl returns a number of columns not present in Yahoo Finance, this may be more useful depending on what you need to do with the data.
data.head() shows
           Open   High    Low  ...  Adj. Low  Adj. Close  Adj. Volume
Date                             ...
1980-12-12  28.75  28.87  28.75  ...  0.422706    0.422706  117258400.0
1980-12-15  27.38  27.38  27.25  ...  0.400652    0.400652   43971200.0
1980-12-16  25.37  25.37  25.25  ...  0.371246    0.371246   26432000.0
1980-12-17  25.87  26.00  25.87  ...  0.380362    0.380362   21610400.0
1980-12-18  26.63  26.75  26.63  ...  0.391536    0.391536   18362400.0
To see the full list of columns returned by Quandl type the following:
print(data.columns)
Index(['Open', 'High', 'Low', 'Close', 'Volume', 'Ex-Dividend', 'Split Ratio',
       'Adj. Open', 'Adj. High', 'Adj. Low', 'Adj. Close', 'Adj. Volume'],
      dtype='object')
Let's plot the 'Adj. Close' vs the 'Close' columns to illustrate why you should be careful when selecting which to work with.
data['Adj. Close'].plot()
data['Close'].plot()
plt.legend()
plt.title("Close vs Adjusted Close Apple")
plt.show()
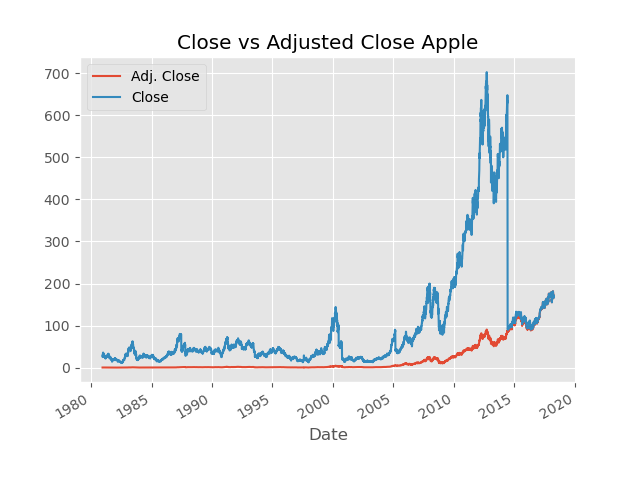
More than a little different right? A short explanation of this is that the adjusted close price takes dividends and stock splits into account. So depending on what you are doing with the data, you should choose the column of interest carefully.