Are you looking to take your cryptocurrency trading to the next level? Look no further than Bybit, the leading crypto derivatives exchange. With advanced trading tools, low fees, and a user-friendly platform, Bybit makes it easy to trade Bitcoin, Ethereum, and other popular cryptocurrencies. And if you sign up using our affiliate link and use the referral code CODEARMO, you'll receive exclusive benefits and bonuses up to $30,000 to help you get started. Don't miss out on this opportunity to join one of the fastest-growing communities in crypto trading. Sign up for Bybit today and start trading like a pro!
What is the SuperTrend Indicator?
The Supertrend indicator is a technical analysis tool that uses a combination of moving averages and ATR (average true range) to identify the trend direction and generate buy and sell signals. The Supertrend formula involves two parameters, namely the period for ATR calculation and the multiplier. The ATR value is calculated based on the high, low, and closing prices of the security, and then multiplied by the multiplier to get the final value. The Supertrend line is plotted by adding the ATR value to the moving average for a bullish trend and subtracting the ATR value from the moving average for a bearish trend. The buy and sell signals are generated when the price crosses above or below the Supertrend line. The Supertrend is a popular indicator among traders and can be used in various trading strategies.
Data Collection
In order to prevent repetition we will use the same logic for data collection as shown in the Bollinger Bands article. For the purposes of this article we will take 4 hour candles for ETHUSDT to create the super-trend indicator.
start = int(dt.datetime(2021, 1, 1).timestamp())

interval = 240
symbol = 'ETHUSDT'
df = pd.DataFrame()

while True:


    response = session.get_kline(category='linear',
                                 symbol=symbol,
                                 start=start,
                                 interval=interval).get('result')

    latest = format_data(response)

    if not isinstance(latest, pd.DataFrame):
        break


    start = get_last_timestamp(latest)

    time.sleep(0.01)

    df = pd.concat([df, latest])
    print(f'Collecting data starting {dt.datetime.fromtimestamp(start/1000)}')

    if len(latest) == 1:
        break
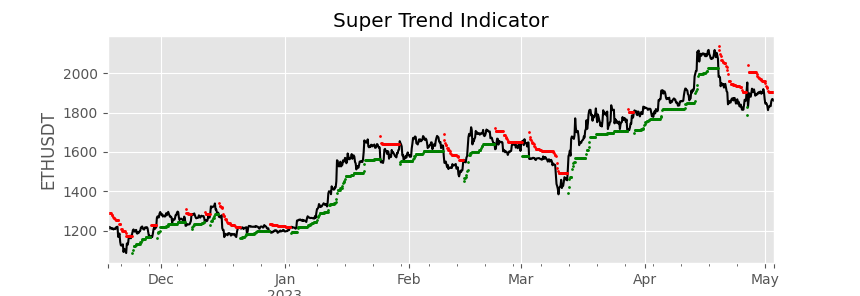
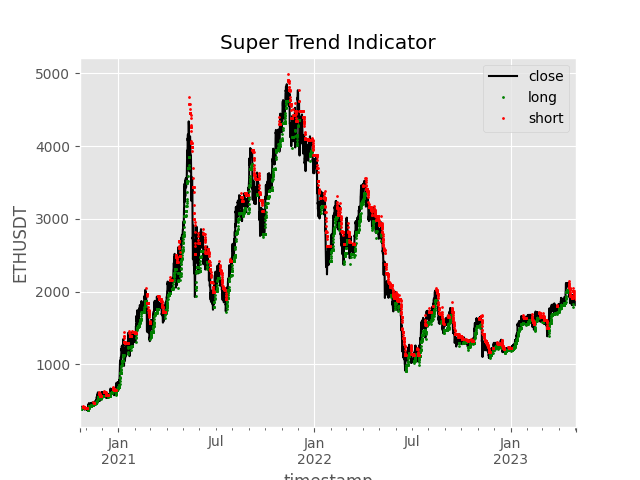
To calculate the Supertrend indicator using pandas_ta, we'll first need to import the library. Once we have pandas_ta installed and imported, we can use the supertrend() function to calculate the indicator. We'll pass in the high, low, and close prices of ETHUSDT, along with a factor that determines the sensitivity of the indicator. Once the Supertrend values are calculated, we can plot them using matplotlib. We'll create a new figure and axis object, and use the plot() function to plot the Supertrend values against the date range of the security's prices. With just a few lines of code, we can quickly calculate and plot the Supertrend indicator for any coin we're interested in analyzing.
df[['SUPERT', 'direction', 'long', 'short']] = ta.supertrend(df.high,
                                                             df.low,
                                                             df.close,
                                                             length=7,
                                                             multiplier=3)

plt.style.use('ggplot')
df.close.plot(label='close',color='black')
df.long.dropna().plot(label='long', style='go',  markersize=1)
df.short.dropna().plot(label='short', style='ro',  markersize=1)
plt.ylabel('ETHUSDT')
plt.title('Super Trend Indicator')
plt.legend()
Super Trend Backtest
In the following analysis, we will compute the simple returns for a buy-and-hold strategy on ETH. Additionally, we will evaluate the returns from a long-short strategy that relies on the SuperTrend indicator, where the direction is denoted as either 1 or -1, corresponding to long or short positions, respectively. To ensure that we avoid lookahead bias, we must shift the returns as demonstrated below, given that the high, low, and close values for a given period are not available until the end of the period.
df['return'] = df.close.pct_change()
df.dropna(subset=['return'], inplace=True)
df['strategy'] = df.direction * df['return'].shift(-1)
df.dropna(subset=['strategy'], inplace=True)

(df['strategy']+1).cumprod().plot(label='Super Trend')
(df['close']/ df.close[:1].values[0]).plot(label='Buy and Hold')
plt.title('SuperTrend Backtest')
plt.ylabel('Cumulative Returns')
plt.legend()
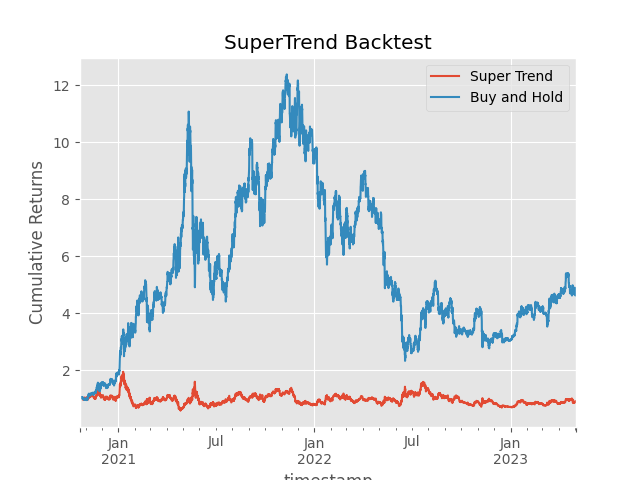
As illustrated in the plot above, a buy-and-hold strategy appears to outperform the strategy of solely following the Supertrend indicator. It is also important to note that we haven't included fees. However, it is important to note that the Supertrend indicator is typically utilized in conjunction with other technical indicators or for establishing stop loss/take profit levels. We urge the reader to experiment with this indicator in tandem with other technical indicators to evaluate its effectiveness in their investment strategy.