Are you looking to take your cryptocurrency trading to the next level? Look no further than Bybit, the leading crypto derivatives exchange. With advanced trading tools, low fees, and a user-friendly platform, Bybit makes it easy to trade Bitcoin, Ethereum, and other popular cryptocurrencies. And if you sign up using our affiliate link through Codearmo and use the referral code CODEARMO, you'll receive exclusive benefits and bonuses up to $30,000 to help you get started. Don't miss out on this opportunity to join one of the fastest-growing communities in crypto trading. Sign up for Bybit today and start trading like a pro!
Users who sign up through the referal link above will also get access to a members only Discord group to ask questions and talk strategies and deployment.
What is High Frequency Trading (HFT)?
High-frequency trading (HFT) is a trading strategy that relies on advanced technology and algorithms to execute a large number of trades at extremely high speeds. It involves the use of powerful computers, sophisticated software, and high-speed data connections to analyze market conditions and execute trades within microseconds or milliseconds.
The key goal of high-frequency trading is to capitalize on small price discrepancies and market inefficiencies that may exist only for very short periods of time. HFT firms employ complex algorithms to identify these opportunities and automatically execute trades to exploit them. The trades can involve various financial instruments, such as stocks, options, futures, and currencies.
In this article we will explain and calculate some high frequency trading indicators for crypto perpetual futures using Python. Perhaps reading this article on websockets would be useful for those that are unfamiliar with the topic, as the code will be very similar.
The code used to recreate these indicators can be found at the end of this article.
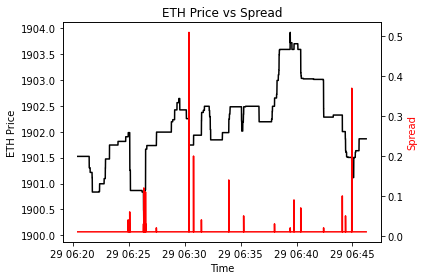
Spread
The bid-ask spread, also known as the bid-offer spread or simply the spread, is the difference between the highest price a buyer is willing to pay (bid) and the lowest price a seller is willing to accept (ask or offer) for a particular financial instrument, such as a stock, bond, or currency pair. In other words, it represents the cost of executing an immediate trade.
We will be using the spread on ETHUSDT, you can view the spread by looking at the difference between the best ask and the best bid. Generally for ETH this will be approx $0.01 which is the minimum tick size.
Spread = Best ask - Best Bid
import pandas as pd
import time
import datetime as dt
import numpy as np
import matplotlib.pyplot as plt


indicators = HftObIndicators(coins = ['ETHUSDT'], channel_type = 'linear')

time.sleep(10)

df = pd.DataFrame(indicators.info['ETHUSDT'])

f = lambda x: dt.datetime.utcfromtimestamp(int(x)/1000)
df.index = df.timestamp.apply(f)


fig, ax1 = plt.subplots()

ax2 = ax1.twinx()
ax1.plot(df.mid_price, 'black')
ax2.plot(df.spread, 'red')
# ax2.plot(df.mid_price, 'blue')
ax1.set_xlabel('Time')
ax1.set_ylabel('ETH Price', color='black')
ax2.set_ylabel('Spread', color='red')
plt.title('ETH Price vs Spread')
plt.tight_layout()
plt.show()
Mid Price
In a typical market, there are buy orders represented by the bid price and sell orders represented by the ask price. The bid price is the highest price at which buyers are willing to purchase the asset, while the ask price is the lowest price at which sellers are willing to sell the asset. The midpoint between these two prices is known as the mid price.
The mid priced is given as :
\(\text{Mid} =\frac{\text{Best Bid}+\text{Best Ask}}{2}\)
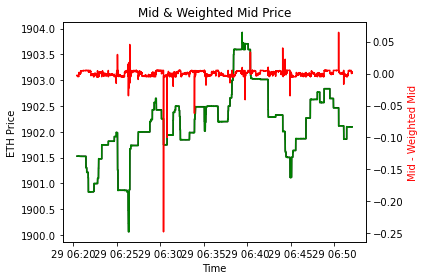
Weighted Mid Price
The weighted mid price is a metric used to determine the average price between the bid and ask prices, taking into account the volume or quantity of orders at each price level. It provides a more nuanced view of the current market price by considering both the price and the liquidity of the orders.
We can view the volume at the bid ask from the top of the orderbook , as can be seen , these values change by the millisecond.
First define the imbalance given as
\(I=\frac{\text{Best Bid Volume}}{\text{Best Bid Volume}+\text{Best Ask Volume}}\)
\(\text{Weighted Mid Price} =\text{Best Bid} (I) + \text{Best Ask}(1 - I)\)
fig, ax1 = plt.subplots()

ax2 = ax1.twinx()
ax1.plot(df.mid_price, 'black', label='mid')
ax1.plot(df.weighted_mid, 'green', label='weighted_mid')
ax2.plot(df.mid_price - df.weighted_mid, 'red')
# ax2.plot(df.mid_price, 'blue')
ax1.set_xlabel('Time')
ax1.set_ylabel('ETH Price', color='black')
ax2.set_ylabel('Mid - Weighted Mid', color='red')
plt.title('Mid & Weighted Mid Price')
plt.tight_layout()
plt.show()
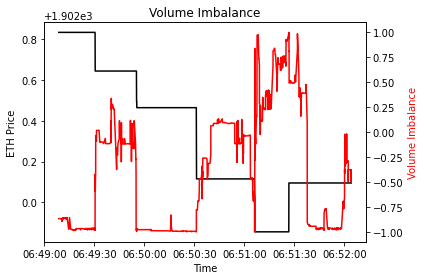
Volume Imbalance
As can be seen from the formula below, the volume imbalance indicator takes values strictly greater than -1 and less than 1. As with the other indicators, these values can be seen from the best/bid ask for ETHUSDT. When the imbalance is closer to -1 we might expect that the next price tick will be downwards, since it takes selling volume to move the price and vice versa for values close to 1.
\(\text{Volume Imbalance}=\frac{\text{Best Bid Volume}-\text{Best Ask Volume} }{\text{Best Bid Volume}+\text{Best Ask Volume}}\)
fig, ax1 = plt.subplots()

ax2 = ax1.twinx()
ax1.plot(df.mid_price[-1000:], 'black', label='mid')

ax2.plot(df.volume_imbalance[-1000:], 'red')
# ax2.plot(df.mid_price, 'blue')
ax1.set_xlabel('Time')
ax1.set_ylabel('ETH Price', color='black')
ax2.set_ylabel('Volume Imbalance', color='red')
plt.title('Volume Imbalance')
plt.tight_layout()
plt.show()
Recommended Books On HFT
Algorithmic and High-Frequency Trading (Mathematics, Finance and Risk)
High-Frequency Trading And Probability Theory
Code
from pybit.unified_trading import WebSocket

class HftObIndicators:

    def __init__(self, coins, channel_type):

        self.coins = coins

        self.ws =WebSocket(channel_type=channel_type, testnet=False)

        self.info = self.populate_info_dict()

        for coin in self.coins:
            self.ws.orderbook_stream(1, coin, self.indicators_callback)


    def populate_info_dict(self):

        signals = {'timestamp': [] ,
                   'mid_price':[],
                   'volume_imbalance': [],
                   'spread':[] ,
                   'weighted_mid': []}

        info = dict()

        for coin in self.coins:
            info[coin] = signals

        return info


    def indicators_callback(self, message):
        data = message.get('data')

        ts = int(message.get('ts'))
        symbol =data.get('s')

        data = self.cast_to_float(data)

        self.info[symbol]['timestamp'].append(ts)
        self.info[symbol]['spread'].append(self.spread(data))
        self.info[symbol]['weighted_mid'].append(self.weighted_mid(data))
        self.info[symbol]['volume_imbalance'].append(self.volume_imbalance(data))
        self.info[symbol]['mid_price'].append(self.mid_price(data))


    @staticmethod
    def cast_to_float(data):
        data['best_bid'] = float(data.get('b')[0][0])
        data['bid_volume'] =float(data.get('b')[0][1])
        data['best_ask'] = float(data.get('a')[0][0])
        data['ask_volume'] = float(data.get('a')[0][1])
        return data

    @staticmethod
    def I(data):
        bv, av = data.get('bid_volume') , data.get('ask_volume')
        return (bv)/(bv+av)

    @staticmethod
    def spread(data):
        return data.get('best_ask') - data.get('best_bid')

    @staticmethod
    def weighted_mid(data):
        P_a , P_b = data.get('best_ask') , data.get('best_bid')
        I = HftObIndicators.I(data)
        return P_b * (1-I) + P_a * I

    @staticmethod
    def volume_imbalance(data):
        bv, av = data.get('bid_volume') , data.get('ask_volume')
        return (bv-av)/(bv+av)

    @staticmethod
    def mid_price(data):
        return (data.get('best_ask')+ data.get('best_bid')) /2